Overlay Trades
Trade makers representing buy or sell orders, are placed on the primary chart pane, above the individual price history intervals (candles) they are associated with via their timestamp.
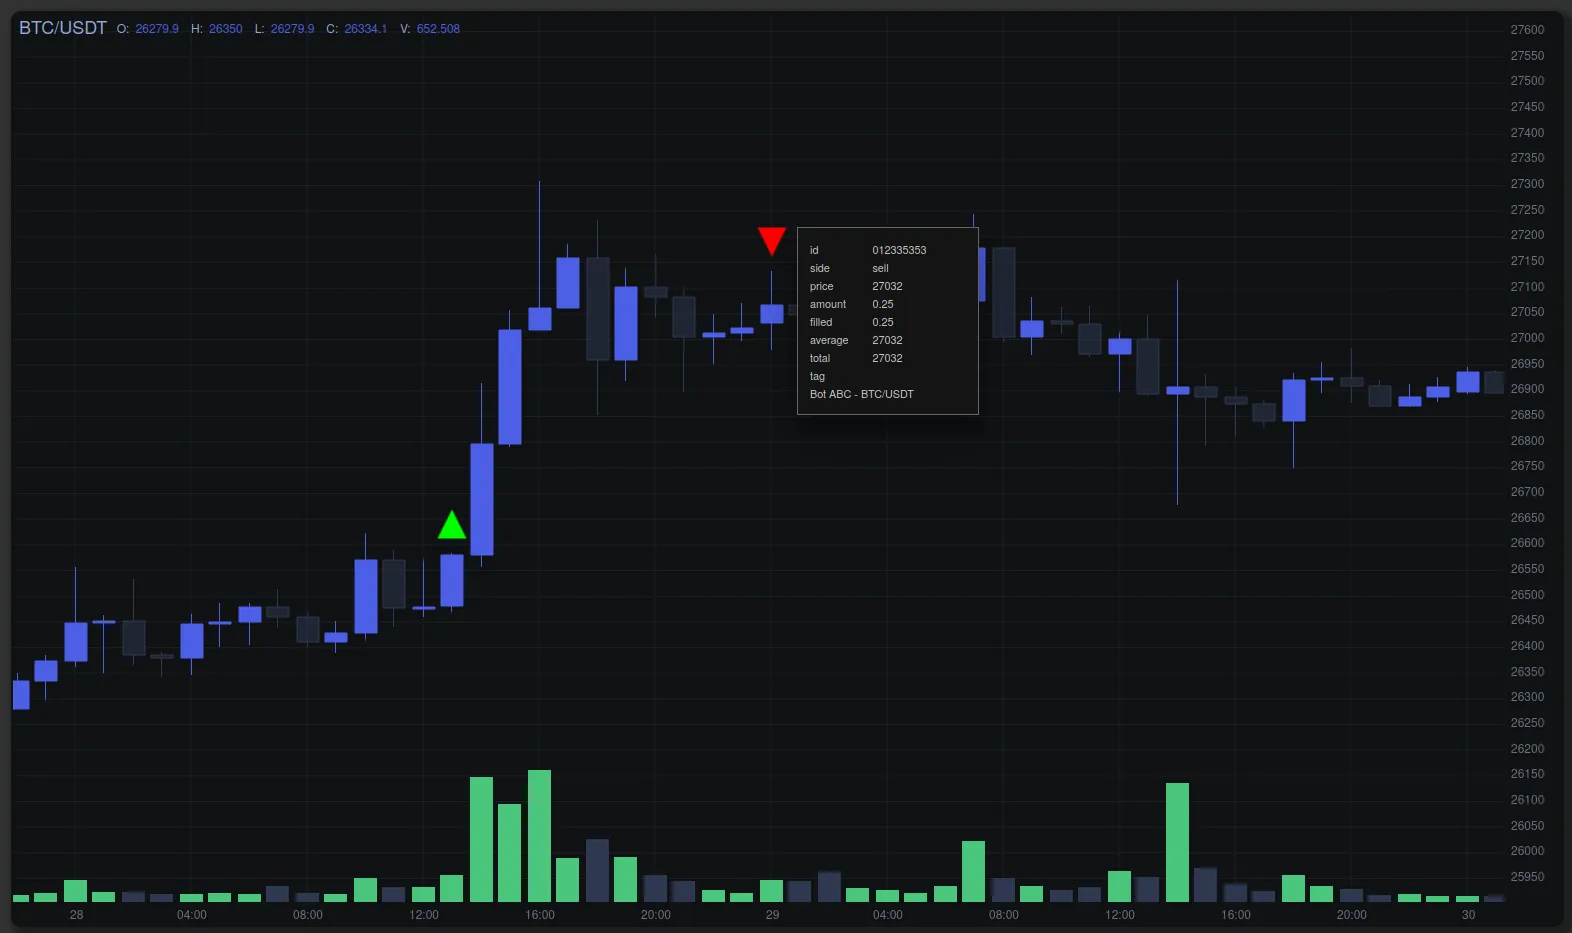
TradeX Chart provides a number of marker icon options, their size and colour are configurable. Trades Settings has more details.
Toggling Trade Markers
Trade Order Data Entries
An individual trade entry has the following format:
const trade = {
  timestamp: 1558605600000, // number - time stamp
  id: "012336352",          // string - trade id
  side: "buy",              // string - buy or sell
  price: 7590,              // number
  amount: 0.25,             // number
  filled: 0.25,             // number
  average: 7845,            // number
  total: 1961,              // number
  tag: "Bot ABC - BTC/USDT" // string - user defined identifier
}
Add Trade
A single trade can be added to the chart data state via the following:
chart.addTrade(trade)Where the trade entry object format is defined in the previous section. addTrade() will validate the trade entry and return a boolean as the result.
Remove Trade
Not implemented yet.
Trade State Data
The chart State Data provides a collection of all of the trades that can be displayed on the chart.
The trades are represented by an object in the primary chart pane of the data state.
The trades object requires the following to be valid:
| Property | Type | Description |
|---|---|---|
| name | string | “Trades” |
| type | string | “trades” |
| settings | object | define how trades are displayed |
| data | array | trade entries |
Trades Settings
The default trade settings are as follows
{
  // icons must be in SVG format
  iconBuy: tradeIcons.arrowUp,
  iconSell: tradeIcons.arrowDown,
  iconHeight: 30,
  iconWidth: 30,
  iconMinDim: 10,
  buyColour: "#0f0",
  sellColour: "#f00",
  offset: 10
}
Icons are expected to be in SVG format.
Trades Data - Trade Entries
Trade entries (objects) are grouped by timestamp in an array as it may be possible that multiple trades may be executed on the same time interval (candle).
const config = {
ohlcv: [],
primary: [
  {
    "name": "Trades",
    "type": "trades",
    "settings": {
      // see above example for all options
    },
    data: {
      1695906000000: [
          {
            timestamp: 1695906000000,
            id: "012336352",
            side: "buy",
            price: 27032,
            amount: 0.25,
            filled: 0.25,
            average: 27032,
            total: 27032,
            tag: "Bot ABC - BTC/USDT"
          }
        ],
        1695945600000: [
          {
            timestamp: 1695945600000,
            id: "012335353",
            side: "sell",
            price: 27032,
            amount: 0.25,
            filled: 0.25,
            average: 27032,
            total: 27032,
            tag: "Bot ABC - BTC/USDT"
          }
        ],
        1696327200000: [
          {
            timestamp: 1696327200000,
            id: "012335354",
            side: "sell",
            price: 27550.6,
            amount: 0.25,
            filled: 0.25,
            average: 27550.6,
            total: 27550.6,
            tag: "Bot ABC - BTC/USDT"
          }
        ]
      }
  }
],
secondary: [],
}
Trade Marker Event
By default, if a trade marker is clicked, it will invoke the trades overlay method which will display the trade data over the chart.
This can be disabled via the chart config.
const config = {
  trades: {
    display: true,
    displayInfo: false
  }
}
The chart emits a trade_selected event which you can subscribe to and invoke your own method.
The event will pass the information for that trade entry to the subscribed event listener.