Overlays
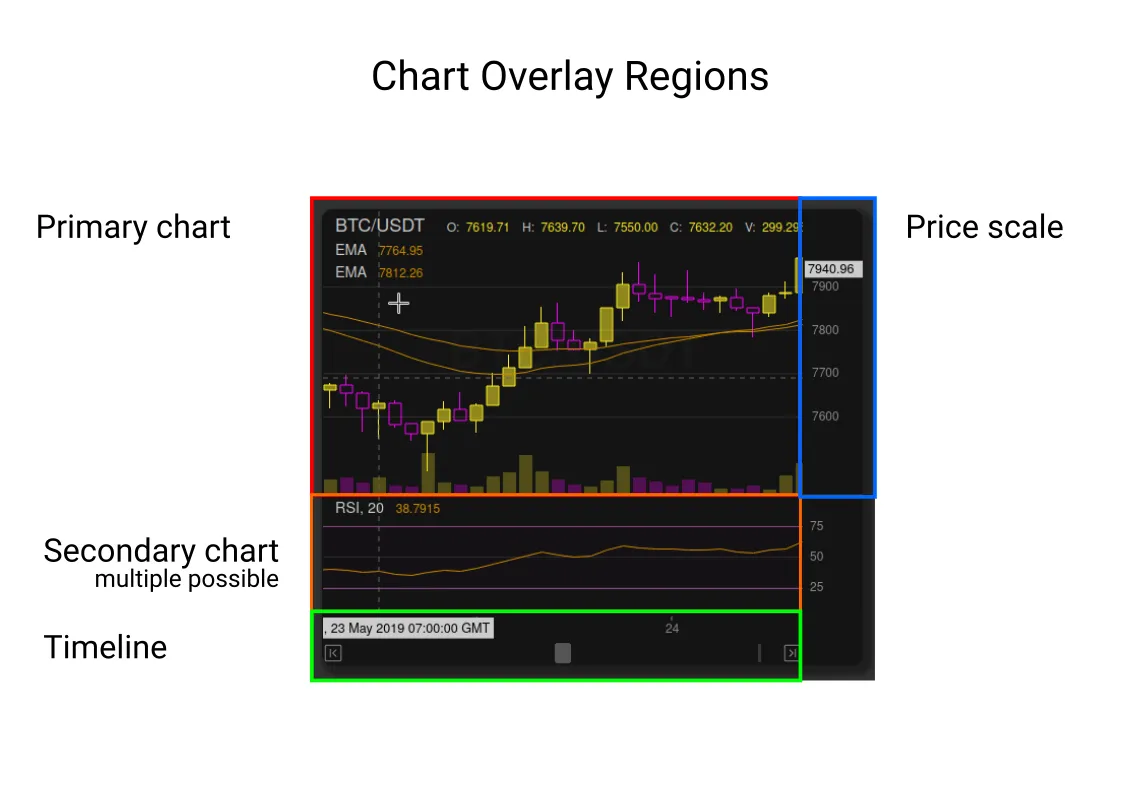
Overlays in the simplest form are a layer, that exist either on:
- Primary Chart Pane (candlestick price view)
- Secondary Chart Panes (indicators that don’t live on the primary chart)
- Y Axis price scale
- X Axis time line
- Main Pane, which lives below all other panes

Features
Overlays (layers) have the following features:
- passive, responding the price date range that chart is viewing eg.:
- candles
- indicators
- active, can respond to input such as the cursor / mouse / pointer position eg.:
- cursor cross hair,
- floating timeline label,
- Y Axis floating live streaming price label
- static remain fixed and do not scroll with the chart or cursor / mouse / pointer eg:
- watermark - can be text or image
- stacked, which means their visual order can be changed
- visibility can be toggled on or off
- can be arbitrarily added or removed
- can have their own visual theme
- have access to the in-built canvas methods for drawing to the overlay, lines,
- boxes, circles, text, images…
- automatically resize with the chart or pane displaying them.
Overlay Data and Properties
The Overlay class provides everything needed to draw on or interact with the chart. The core property points to the root of the chart and thus gives you access to everything else contained therein.
| Name | Description |
|---|---|
| core | chart root API |
| parent | pane that overlay is applied to |
| config | chart config |
| theme | chart theme |
| params | parameters that the overlay was created with |
| target | layer methods and properties |
| scene | layer canvas provided to the overlay |
| chart | chart pane |
| xAxis | methods and properties for the timeline |
| yAxis | methods and properties for the (price) scale |
| data | if the overlay is an indicator, data is found here |
| context | “chart”, “xAxis”, “yAxis” - where the overlay is added |
| plots | methods to draw on the overlay or any other canvas |
Built-in Overlays
The chart is built by layering a number of default overlays. Any custom overlays or Indicators are thus simply further layers atop these.
| Name | Key | Default |
|---|---|---|
| Chart Candles | ||
| Chart Cursor | ||
| Chart Grid | ||
| Chart High Low | optional | |
| Chart News Events | events | optional |
| Chart Streaming Candle | ||
| Chart Trades | trades | optional |
| Chart Volume | ||
| Chart Watermark | optional | |
| Indicators | optional | |
| Scale Cursor | ||
| Scale Labels | ||
| Scale Price Line | optional | |
| Time Cursor | ||
| Time Labels |
Adding Optional Overlays
To add indicators to the chart, refer to the indicator documentation.
Optional overlays are always present, and can be enabled via:
- chart config
- addOverlay() API method
The current list of optional overlays is as follows:
- Scale Price Line -
stream: {}see: Streaming Price Data - Chart High Low -
hightLow: true - Chart Watermark -
watermark: { text: "text goes here" }see: TODO: Watermark Options
The following ovelays are an exception and are added via the initial chart state supplied by the chart config, because they may provide a dataset to be included in the chart data state. See their corresponding documentation for more detail.
Custom Overlays
Please refer to the Custom Overlays documentation to find out how to define, register, add and remove overlays via the API.